
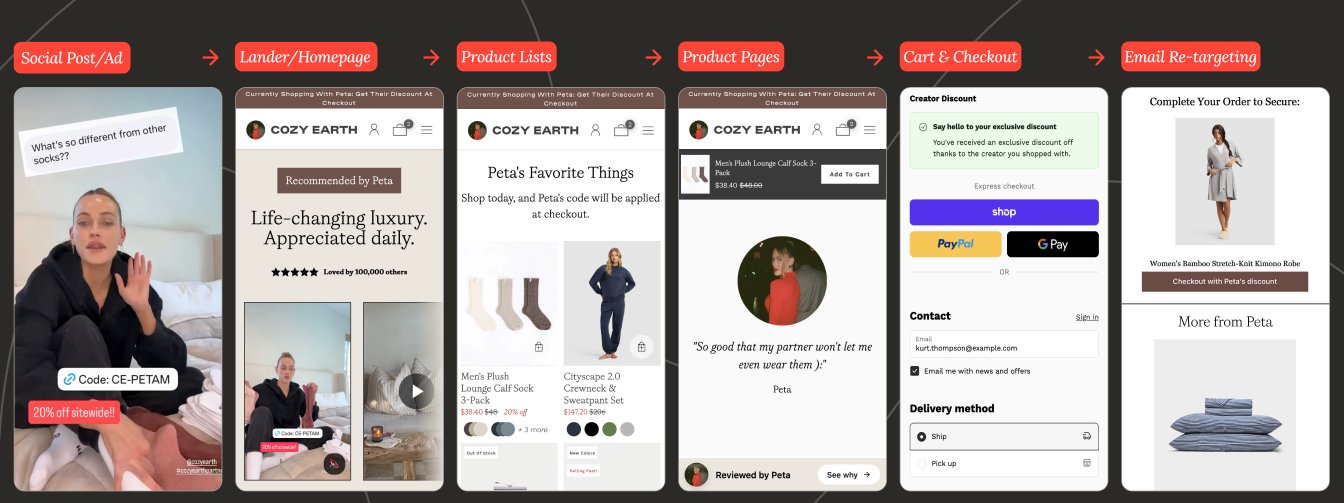
Most brands running creator programs track the wrong things. Impressions, reach, follower counts, metrics that feel significant but don't connect to revenue. When you move to co-branded creator storefronts, you have the infrastructure to track what actually matters. The question is knowing which numbers to pull and what they mean.
This post gives you a complete framework for measuring creator storefront ROI: the core metrics, how to set up your baseline, and the benchmarks to compare against.
Why Standard Affiliate Metrics Aren't Enough
Standard affiliate reporting shows clicks and conversions, but misses landing page effectiveness, AOV comparisons, customer lifetime value, and traffic quality. CreatorCommerce storefronts provide deeper insights because each unique URL isolates creator-level performance data, revealing which creators drive high-intent traffic versus volume.
Standard affiliate reporting tells you clicks, conversions, and commissions. That's useful for paying creators accurately. It's not sufficient for understanding whether your storefront strategy is working.
What standard affiliate metrics miss:
- Whether the landing page itself is converting or killing intent
- How average order value compares between storefront traffic and other channels
- Whether customers who arrive via a creator storefront have higher lifetime value
- Which creators drive quality traffic versus high-volume-low-intent traffic
Co-branded storefronts give you a new layer of data because each storefront is a distinct URL. That means you can isolate performance at the creator level, not just the program level.
The Three Tiers of Creator Storefront ROI
CreatorCommerce tracks ROI across three levels: Tier 1 measures weekly conversion rates and AOV (with 40-214% CVR improvements reported), Tier 2 analyzes monthly creator activation and revenue per creator, and Tier 3 evaluates quarterly repeat purchase rates and lifetime value by acquisition source.
Think about storefront ROI in three tiers, each one deeper than the last.
Tier 1: Conversion Metrics (Week-over-Week)
These are the immediate, operational metrics. Pull them weekly.
Storefront CVR (Conversion Rate)
The percentage of sessions that result in a purchase. This is your primary indicator that the storefront is doing its job.
How to calculate: Purchases ÷ Sessions × 100
Benchmark:</em> CreatorCommerce customers see an average CVR increase of 40-214% compared to standard affiliate links. Cozy Earth's CVR increased 214%</strong> after migrating from promo codes to on-theme storefronts. Healf saw a 40.8% CVR increase compared to homepage affiliate traffic.
Storefront AOV (Average Order Value)
The average basket size from customers who purchase via a creator storefront.
How to calculate: Total revenue from storefront ÷ Number of orders
Benchmark:</em> Curated product selection drives AOV up because customers are shopping a focused, intentional list. Cozy Earth saw a 67.37% AOV increase via storefront traffic compared to standard affiliate links.
Bounce Rate
The percentage of visitors who land on the storefront and leave without interacting. High bounce rates signal a mismatch between the creator's audience and the storefront experience.
Tier 2: Program Health Metrics (Monthly)
These metrics tell you whether the storefront strategy is improving your creator program as a whole, not just whether individual pages are converting.
Creator Activation Rate
The percentage of creators in your program who are actively generating storefront traffic. Storefronts tend to lift activation because creators are more likely to share a link they're proud of.
How to calculate: Creators with at least 1 click in the period ÷ Total creators in program × 100
Why it matters:</em> Cozy Earth saw a 63.41% month-over-month increase in link sharing in the first four months after launching on-theme storefronts: a direct signal that creators engage more with a quality experience.
Revenue Per Creator
Total storefront revenue ÷ Number of active creators in the period. This normalizes for program size and lets you track whether the average creator is becoming more valuable over time.
Storefront Revenue as % of Total Creator Program Revenue
As you migrate creators from standard affiliate links to storefronts, this number should grow. It's a proxy for how much of your creator program has been upgraded.
Tier 3: Lifetime Value Metrics (Quarterly)
This is where you prove long-term ROI, not just short-term lift.
Repeat Purchase Rate: Storefront Customers vs. Other Channels
Customers who arrive through a co-branded creator storefront often convert with higher intent; they were pre-sold by the creator before clicking. Does that translate to higher repeat purchase rates compared to paid acquisition or direct traffic?
How to calculate: Segment your Shopify customers by acquisition source. Compare 90-day repeat purchase rate for storefront-sourced customers vs. your other channels.
Customer LTV by Acquisition Source
A customer who came in through a creator storefront at $65 AOV is worth more than a paid customer who came in at $40 AOV, even if the paid customer converted at a lower CPA. LTV calculation makes this visible.
Where to find this: Shopify Analytics > Customers > Customer cohorts, filtered by referral source. Or your email/CDP platform if you have source-level segmentation.
Setting Up Your Baseline
Before measuring ROI, pull 30 days of baseline data from your current affiliate platform, then migrate top creators to CreatorCommerce storefronts first while keeping others as a control group. CreatorCommerce customers typically see measurable lift within 2-4 weeks with minimum 200 sessions per creator.
Before you can measure ROI, you need a clean before/after comparison. The most common mistake brands make is switching all their tracking links at once and losing the baseline.
The right approach:
- Before migration: Pull 30 days of conversion data from your affiliate platform for the creators you're migrating. Record CVR, AOV, and total revenue per creator. This is your baseline.
- Migrate in batches: Switch your top 10 creators to CreatorCommerce storefronts first. Leave the rest on their existing links. This gives you a live control group.
- Wait one full creator cycle: Typically 2-4 weeks, depending on posting frequency. Don't judge storefront performance on 3 days of data.
- Pull the comparison: Same metrics, same creators, same time window. CVR, AOV, revenue. The delta is your before/after lift.
- Check statistical significance: Focus your early measurement on creators with enough traffic volume: 200+ sessions per month as a rough threshold.
The Attribution Question
CreatorCommerce attribution captures direct same-session purchases, but also benefits from extended cookie windows (30-90 days) and UTM parameters. Use CreatorCommerce alongside GA4 and Shopify's native attribution to understand how storefronts drive first-touch intent even when purchases happen later.
The most common measurement challenge with creator storefronts is attribution: specifically, how do you accurately credit a creator when a customer doesn't purchase on the first visit?
Direct attribution: Customer clicks creator link → lands on storefront → purchases in the same session. Your affiliate platform's cookie captures it.
Assisted attribution: Customer clicks creator link → browses but doesn't purchase → returns directly or via email → purchases. The storefront drove intent, but the affiliate cookie may not capture the final-session conversion depending on your cookie window settings.
Cross-device attribution: Customer clicks on mobile → purchases on desktop later. Most affiliate platforms handle this imperfectly without additional tracking setup.
How to get cleaner attribution:
- Set your affiliate cookie window as long as your platform supports (30-90 days is standard)
- Use UTM parameters on storefront URLs and segment in GA4 to catch assisted conversions
- Shopify's native attribution report shows "first interaction" vs. "last interaction"; use both to understand the full picture
- If your platform supports it, enable view-through or post-click attribution for creator traffic specifically
What Good Looks Like: Benchmarks
CreatorCommerce customers report 40-214% CVR lift, 30-67% AOV increase, 60%+ month-over-month link sharing growth, and 1,000-2,000+ curated product collections in large programs, demonstrating that co-branded storefronts significantly outperform standard affiliate approaches.
Based on CreatorCommerce customer data:
| Metric | Benchmark vs. Standard Affiliate Links |
|---|---|
| CVR lift | 40-214% increase |
| AOV lift | 30-67% increase |
| Link sharing / creator activation | 60%+ MoM increase in first 4 months |
| Creator storefront collections curated | 1,000-2,000+ (for large programs) |
These ranges are wide because they depend on your baseline. A brand currently sending all creator traffic to a generic homepage has more room to gain than a brand already running custom landing pages.
Reporting to Stakeholders
Present three metrics to leadership: CVR lift (proof of effectiveness), revenue uplift (CVR × AOV × sessions), and creator activation rate (program health). For a 50,000 monthly session program with 2.5% CVR improvement, CreatorCommerce drives 1,250 incremental purchases per month.
When presenting creator storefront ROI internally, build your case around three numbers:
- CVR lift: the clearest proof that the storefront is doing its job
- Revenue uplift: CVR × AOV × sessions = total incremental revenue from the migration
- Creator activation rate: evidence that the program is healthier, not just that individual pages convert better
The revenue uplift calculation is the most persuasive. If your creator program drives 50,000 sessions per month and storefront CVR is 2.5% higher than your old links, that's 1,250 additional purchases per month. Multiply by your AOV and you have a monthly incremental revenue number that justifies the investment in minutes.
Related Articles
- Creator Storefront vs. Affiliate Link: Which Drives More Revenue?
- The Conversion Gap: What Happens After an Affiliate Click (and Why Most Programs Ignore It)
- Affiliate Program vs Ambassador Program on Shopify: What's the Difference and Which Should You Build?
- What Is a Creator Storefront? The Complete Guide for DTC Brands
FAQ
CreatorCommerce's reporting layer integrates with Superfiliate for conversion tracking, GA4 for bounce rate and session depth, and Shopify analytics for AOV comparison. Wait 2-4 weeks per creator (200+ sessions minimum) before evaluating storefront ROI, and always compare against previous affiliate link performance, not site-wide CVR.
How long should I wait before measuring storefront ROI? At least two to four weeks per creator, and ideally one full content cycle. Don't draw conclusions from fewer than 200 storefront sessions: the noise-to-signal ratio is too high.
Should I compare storefront CVR to my site-wide CVR or to my previous affiliate link CVR? Always compare to your previous affiliate link CVR for the same creator. Site-wide CVR includes direct traffic, email, paid, and organic, all of which have different intent profiles.
What if my storefront CVR is lower than expected? Check three things first: product-audience fit, page load speed, and mobile experience. The most common cause of underperforming storefronts is a product curation mismatch.
Can I measure Creator Storefront ROI inside Superfiliate? Superfiliate tracks clicks and conversions attributed to each creator's link. If you've updated those links to point to CreatorCommerce storefronts, Superfiliate's existing reporting captures the conversion data. For deeper metrics like bounce rate, session depth, and AOV comparison, layer in Google Analytics or your Shopify analytics.
Where can I find step-by-step setup documentation?
CreatorCommerce's Help Center has detailed guides for every step. Start with Affiliate link tracking reference and Shopify order & customer tagging reference for the implementation specifics covered in this article.
How does CreatorCommerce track which creator drove the sale?
CreatorCommerce writes three cart attributes (cc-creator-id, cc-creator-handle, and cc-shop-id) into the Shopify cart when a shopper arrives via a creator's link. These attributes persist through checkout and appear on the order, enabling accurate attribution that works alongside your existing affiliate platform's tracking.
Ready to measure real ROI from your creator program? Book a Demo →
Related reading


%201.png)
%201.png)